An Introduction to Streamline Plots in CFD
What is a Streamline Plot?
A streamline plot is a powerful tool used in various fields, particularly in fluid dynamics, to visualize flow patterns and understand the behavior of fluid flow. By depicting the flow of particles in a fluid, streamline plots provide valuable insights into the direction and velocity of flow. In this article, we will explore the basics of streamline plots, delve into the science behind them, learn how to create them, and discuss their interpretation and real-world applications.
Understanding the Basics of Streamline Plots
Streamline plots, also known as flow line or streakline plots, represent the paths followed by particles in a fluid flow. These plotlines provide a visual representation of the flow direction at each point, allowing researchers and engineers to comprehend complex flow patterns and identify flow features such as vortices and eddies. Streamline plots are essential for analyzing fluid behavior in various domains, including aerodynamics, hydrodynamics, and even weather forecasting.
When studying fluid flow, it is crucial to have a clear understanding of the key components that make up a streamline plot. These components work together to create a comprehensive visualization of the flow patterns, enabling researchers to gain valuable insights into the behavior of the fluid.
Definition and Purpose of Streamline Plots
Streamline plots, also known as flow line or streakline plots, represent the paths followed by particles in a fluid flow. These plotlines provide a visual representation of the flow direction at each point, allowing researchers and engineers to comprehend complex flow patterns and identify flow features such as vortices and eddies. Streamline plots are essential for analyzing fluid behavior in various domains, including aerodynamics, hydrodynamics, and even weather forecasting.
Streamline plots serve a crucial purpose in fluid dynamics, as they allow researchers to visualize and analyze the flow patterns of a fluid. By observing the paths followed by particles in the flow, scientists can gain valuable insights into the behavior of the fluid and make informed decisions in various fields.
For example, in aerodynamics, streamline plots are used to study the flow of air around aircraft wings, helping engineers optimize wing design for maximum lift and minimum drag. In hydrodynamics, these plots are used to understand the flow of water in rivers, lakes, and oceans, aiding in the design of efficient water transportation systems. Even in weather forecasting, streamline plots are utilized to analyze atmospheric flow patterns and predict the movement of weather systems.
Key Components of a Streamline Plot
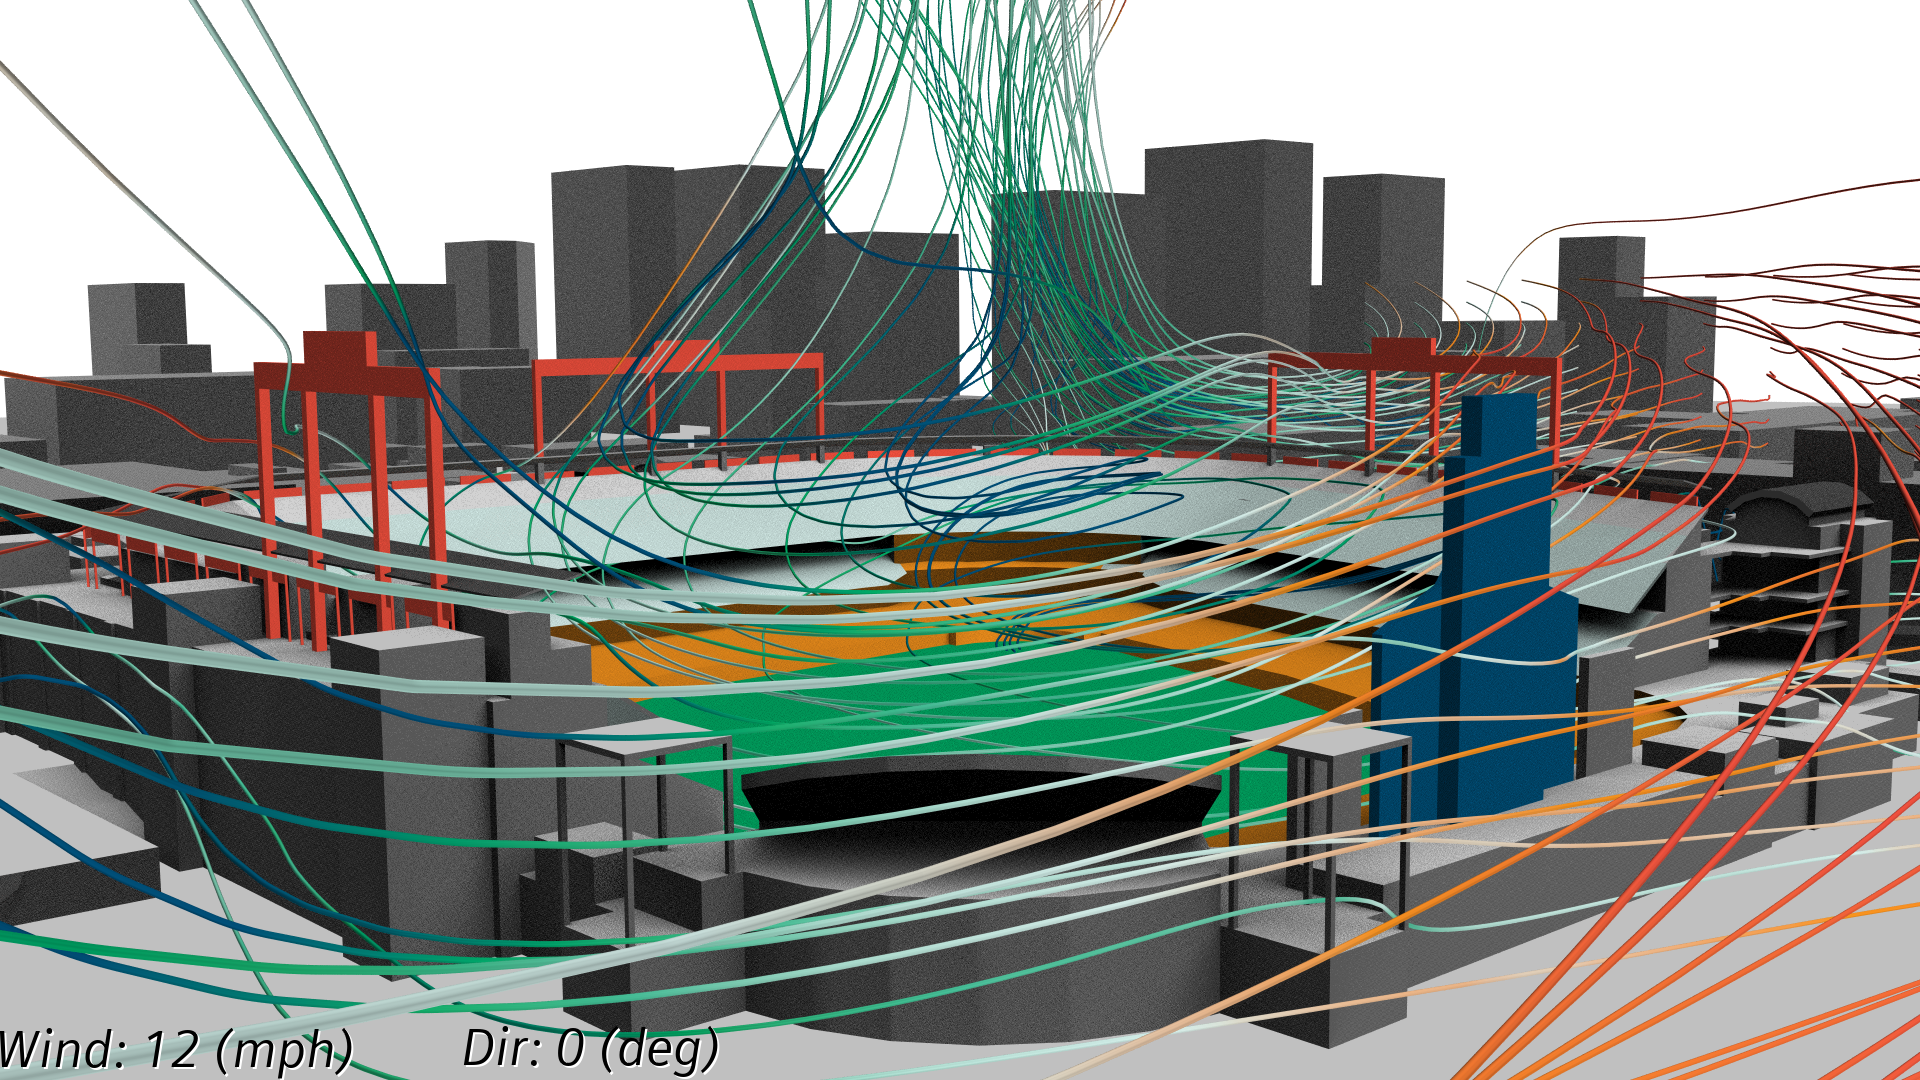
A streamline plot consists of several key components, each serving a specific purpose in visualizing the flow patterns. The most crucial element is the streamline itself, represented by a line that follows the direction of the fluid flow at each point. The density of streamlines throughout the plot helps to convey the velocity profile of the fluid. Additionally, color mapping can be applied to indicate other properties of the flow, such as temperature or pressure.
Streamlines are the primary visual representation of the flow direction in a streamline plot. These lines are drawn in such a way that they are tangent to the velocity vector at each point in the flow field. By following the streamlines, researchers can observe the path that particles in the fluid would take as they move through the flow.
The density of streamlines in a plot provides information about the velocity profile of the fluid. A higher density of streamlines indicates a higher velocity, while a lower density suggests a lower velocity. This density variation helps researchers identify regions of high and low flow velocity, enabling them to analyze the behavior of the fluid in different parts of the flow field.
In addition to streamlines, color mapping can be applied to a streamline plot to represent other properties of the flow, such as temperature or pressure. By assigning different colors to different values of these properties, researchers can gain a deeper understanding of the fluid behavior and identify specific flow features or phenomena.
Overall, the key components of a streamline plot work together to provide a comprehensive visualization of the flow patterns in a fluid. By analyzing these plots, researchers can uncover valuable insights into the behavior of the fluid and make informed decisions in various fields of study.
The Science Behind Streamline Plots
Mathematical Concepts Involved
Mathematical concepts underpin the construction and interpretation of streamline plots. The governing equations of fluid flow, such as the Navier-Stokes equations, provide the basis for calculating the velocity field of the fluid. With this information, streamlines can be traced by solving a set of differential equations. Numerous numerical methods and algorithms, such as Euler's method or Runge-Kutta methods, are employed to approximate these solutions and generate the streamline plots.
Role of Streamline Plots in Fluid Dynamics
In the field of fluid dynamics, streamline plots play a crucial role in understanding and analyzing various flow phenomena. By visualizing the flow field, researchers can identify areas of turbulence, recirculation zones, and points of stagnation. Streamline plots also aid in optimizing the design of fluid systems, enabling engineers to assess the impact of different geometric configurations and fluid parameters on flow behavior.
Creating a Streamline Plot
Tools and Software for Streamline Plotting
Several tools and software packages exist to facilitate the creation of streamline plots. Computational Fluid Dynamics (CFD) software, such as ANSYS Fluent or OpenFOAM, provides advanced capabilities for simulating and visualizing fluid flow. These software packages offer dedicated modules and functions specifically designed to generate detailed streamline plots with customizable parameters and options. Alternatively, programming languages like Python, coupled with popular visualization libraries such as Matplotlib and Plotly, offer flexibility and control in the creation of streamline plots.
Step-by-Step Process of Creating a Streamline Plot
Creating a streamline plot involves a systematic step-by-step process. First, the fluid domain and boundary conditions need to be defined. Next, the governing equations are solved numerically to obtain the velocity field. From there, streamlines are traced by integrating the velocity vector field. Finally, the plot is rendered with appropriate annotations and visual features to enhance understanding and convey relevant information about the flow field.
Interpreting Streamline Plots
Reading and Understanding Streamline Plots
Interpreting streamline plots requires a keen understanding of flow behavior and the characteristics of the system under study. The density and spacing of streamlines indicate the fluid velocity at various regions, with closely spaced streamlines indicating high velocity and wide spacing indicating low velocity. Analysis of the streamlines' direction helps identify flow patterns, such as vortex shedding or separation zones. Additionally, the color mapping on the streamline plot can represent different parameters, aiding in the interpretation of the flow's physical properties.
Common Misinterpretations and How to Avoid Them
While streamline plots provide valuable insights, there are common pitfalls that can lead to misinterpretation or misunderstanding. It is important to ensure that the chosen color map is appropriate for the property being visualized and that the color-bar scale is clearly defined. Additionally, care must be taken to avoid misjudging flow behavior solely based on individual streamlines, as these may not represent the entire flow field accurately. A holistic approach, considering the overall flow pattern and system dynamics, is essential to avoid erroneous conclusions.
Applications of Streamline Plots
Use of Streamline Plots in Meteorology
Meteorologists utilize streamline plots to understand air flow patterns and predict weather phenomena. By analyzing streamlines on weather maps, meteorologists can identify regions of convergence, divergence, and vertical motion, aiding in forecasting weather systems such as cyclones or thunderstorms. Streamline plots also play a role in understanding the transport of pollutants or airborne particles, helping to assess their dispersion and potential impact on the environment.
Streamline Plots in Engineering and Design
In engineering and design, streamline plots have diverse applications across various disciplines. They are used extensively in aerodynamics for analyzing the flow around aircraft wings, providing insights into lift and drag generation. In the automotive industry, streamline plots aid in optimizing vehicle design for reduced aerodynamic drag and improved fuel efficiency. Streamline plots also find utility in analyzing fluid flows within pipes, channels, and industrial equipment, helping engineers optimize their performance and identify potential areas of energy loss or inefficiency.
Conclusions
In conclusion, streamline plots are an invaluable tool for analyzing and visualizing fluid flow patterns in diverse fields. By providing a visual representation of streamlines, these plots enable researchers, engineers, and scientists to gain insights into complex flow behavior, optimize designs, and make informed decisions. With their wide range of applications and the advent of advanced software tools, streamline plots continue to play a pivotal role in advancing our understanding of fluid mechanics.