CFD Modeling: Comparetto Cubes to Decrease Virus Transmission Rates
What if a homemade air-filter could have a huge impact on your child’s school? We set out to discover if these easy to make Comparetto Cubes can actually decrease virus transmission rates.
With kids going back to school and inconsistent ventilation solutions being presented across our children’s school system, we decided to dig in and find the most cost-effective safety precaution that could make a difference in preventing the spread of COVID-19 in classrooms. This is what we found. Check your brand preferences at the door.
What particle sizes should we be capturing?

Figure 1: Expired Droplet Size Distributions
If you have followed the many discussions surrounding efficacy of face masks, you may have seen or heard that cloth facemasks can’t be effective because a COVID-19 virus particle is so small that it will pass right through most woven fabrics. What this argument fails to recognize is that virus cells are never isolated. Instead, virus cells inhabit larger respiratory fluid droplets. The virus needs this medium to stay viable (1); once the droplet has evaporated, the virus has a short life expectancy.
So, what size respiratory droplets do we really need to be concerned with? There have been several studies recently published on the size of respiratory droplets emitted during common activities. These studies show that respiratory droplet sizes are dependent upon the activity and the individual, but generally fall into size distributions like those shown here (2), which peak at around 25-50 micrometers [µm] in diameter and tail out around 500 µm.
Filtration
The way that hospitals deal with airborne virus transmission is to create negatively pressurized, highly ventilated spaces. Unfortunately, it is impossible to create such environments in existing buildings within reasonable costs. A second approach is to increase the amount of clean air delivered to rooms, by either increasing HVAC ventilation rates or by opening doors and windows. Higher HVAC ventilation rates are often cost prohibitive, while opening doors and windows to outside air may not be possible due to climate or building infrastructure.

Figure 2: MERV Rating and Removal Efficiency Across Particle Sizes
The most accessible option, on the other hand, are portable air filters (aka air purifiers). By the way, most purifiers and air filtration devices are rated by what’s called their ‘MERV’ rating (Minimum Efficiency Reporting Value), which characterizes the removal efficiency at various contaminant particle sizes. In general, the higher the MERV rating, the higher the particle capture rate at smaller particle sizes (and more expensive) the filter. Most commercial off the shelf purifiers feature filters with MERV ratings above 17, which are also known as High-Efficiency Particulate Air (HEPA) filters. The relationship between particle size and capture efficiency, for various MERV rated filters, is shown in Figure 2. From this graph we can see that if we use a criterion of 90% capture of particles of 1 µm or larger, a MERV 14 or higher filter is needed (as shown by the red lines). However, if we relax that constraint to 70% of 2 µm or larger particles, a MERV 10 filter will be sufficient (as shown by the green lines).
The Cube Filter
Our biggest constraint when considering helping our local school was budget, and our biggest objective was maximizing the amount of air treated by the filter. With over 30 classrooms, the school could not afford commercial off the shelf purifiers, where the cheapest options are more than $250. Besides, these filters often provide very little airflow, due to the highly restrictive HEPA filters, and can treat only very small rooms.

Figure 3: Comparetto Cube Assembly and Operation Schematic
Luckily, we discovered what has been coined the Corsi/Rosenthal/Comparetto Cube after its various inventors and tweakers. As shown in Figure 3, the Cube consists of a box fan assembled together with four (4) 20” X 20” HVAC furnace filters and sealed with duct tape along joints. The Cube can sit on the floor or have a fifth wall or filter added in other alternate arrangements.
The Cube design is intended to maximize airflow throughput by maximizing the filter surface area and thereby decreasing its resistance to flow. It is also very cost effective (~$90) and easy to assemble. To build your own, you can find detailed building instructions online. It’s not rocket science, and you don’t have to be an engineer or builder to make one of these cubes. If you can follow directions and work a roll of duct tape, you can do it. Seven volunteers from our school’s PTA made and delivered 36 Cubes in one afternoon.
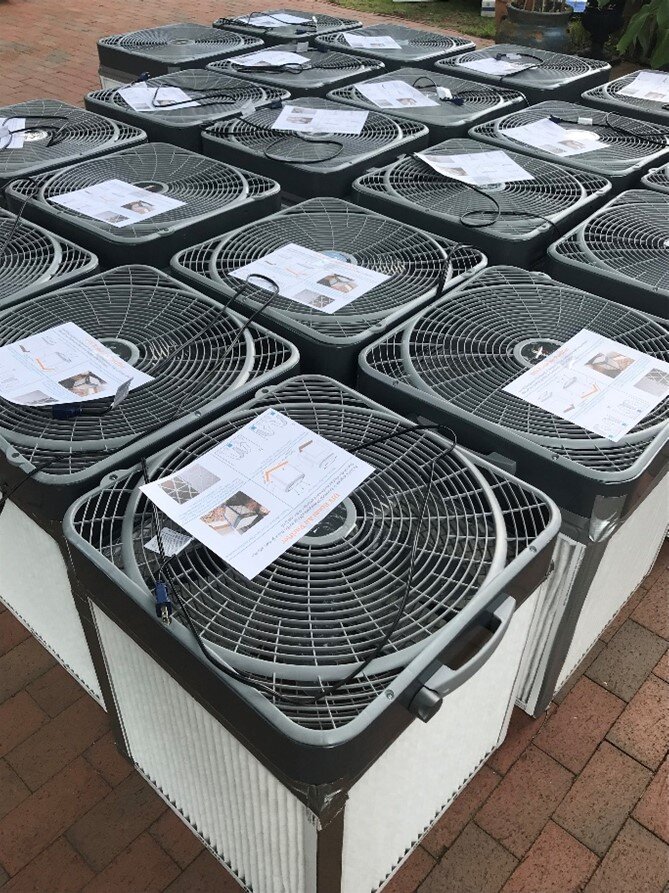
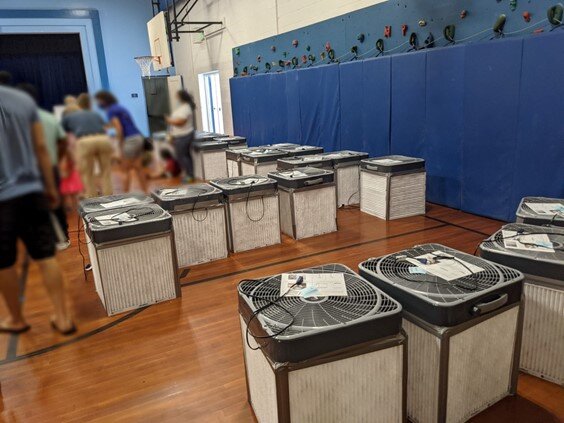
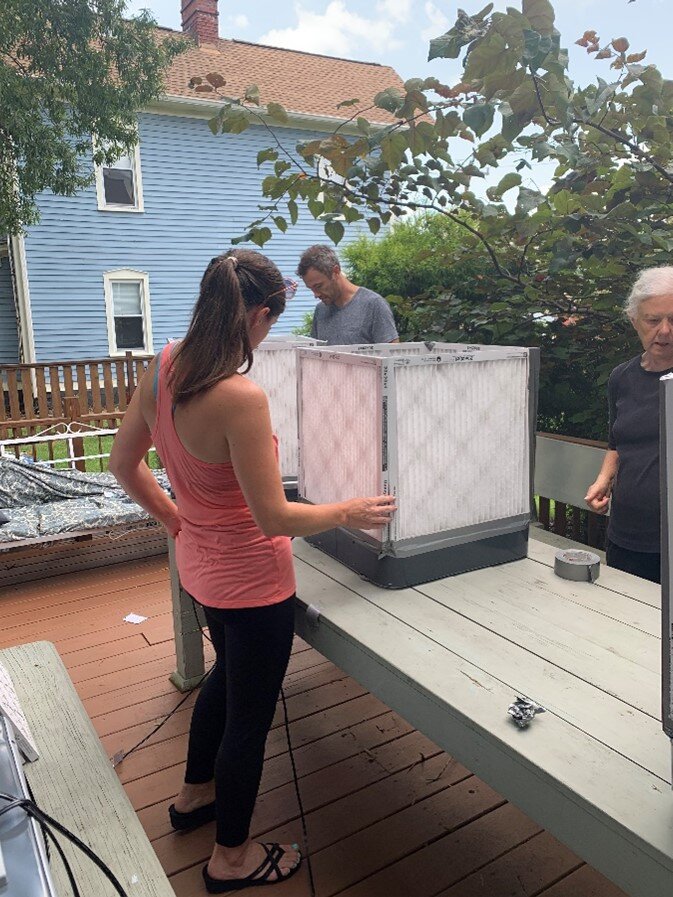
Figure 4: DIY Filter Assembly and Completed Comparetto Cubes
The Cube achieves a much higher airflow throughput because of the large filter surface area available to flow, thus providing a lesser resistance to flow, versus a single filter attached to the back of a fan. Work by others has verified that the use of four MERV 13 filters maintains air flowrates as great as 60% of the uninhibited fan flowrate and that Cubes with MERV 11 filters can provide better filtration across all particle sizes than a $900 HEPA filter. Those data points are good enough for us, and we decided that our contribution would be using Computational Fluid Dynamics (CFD) to analyze potential Cube locations and orientations in generic room configurations.
Analysis and Results
To set up the Cube airflow conditions, we needed to first select the fan. We chose the Lasco Power Plus because of its availability, cost, and relatively high advertised flowrate (~2000 CFM). Box fans are particularly troublesome to choose based on performance, as manufacturers don’t provide any real performance specifications. We also chose Honeywell MERV 11 filters, again because of their low cost, low resistance to airflow, and ability to filter droplets as small as 1 µm at up to 80% efficiency.
Computational Fluid Dynamics Simulations

Figure 5: Classroom Simulated
For the CFD simulations comparing Cube locations and orientations, all ventilations systems were assumed to be off, with doors and windows closed, providing the worst case for virus dispersion. The classroom (26’ X 18’ X 8’ = 3744 ft3) simulated is shown in the following figure, with, for example, two filters shown in white on opposite ends of the classroom.
The fans purchased for the Cubes (Lasko 20 in. Power Plus Box Fans) are known for their relatively high flowrates (~2000 CFM) at an affordable price point ($30). After assembly, we measured that the resistance added by MERV 11 furnace filters reduced this throughput to ~1400 CFM, which was used as an input condition into the CFD model. For comparison, this flowrate is around 38 times the throughput provided by the Honeywell HPA300 Air Purifier (37.2 CFM), a popular air purifier priced at $250 which we also tested in CFD as our control.
To assess how effectively the Cube performs when filtering potentially virus-laden airborne particles, we initially seeded the room airspace with four sizes of water droplets: 3, 10, 30, and 100 µm. For each droplet size, 6500 droplets were homogeneously injected into the classroom during the first 1 second of simulation time. The upper size limit of 100 µm was chosen because particles larger than this are quick to fall to the nearest horizontal surface and are not typically considered airborne. The lower level of 3 µm was chosen as less than 0.001% of the total mass of the droplets in the assumed distributions shown in Figure 1 are less than 3 µm.
A time-dependent simulation of particle motion is then used to track the number of particles (of the initial 6500 injected) that are filtered by the Cube, land on surfaces in the room, or remain airborne over time.
Results
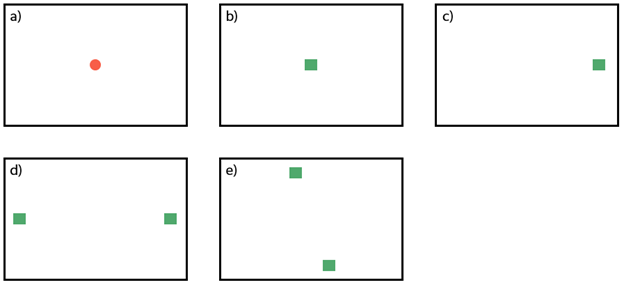
Figure 6: a) Honeywell HPA 300 Center of Room, b) Cube Center of Room, c) Cube End of Room – Centered, d) Two Cubes – End of Room – Centered, e) Two Cubes – Sides of Room – Slightly Off Center
Five air purifier location scenarios were tested, as shown in Figure 6 in plan. In all Cube cases, Cubes were placed on the floor with fans pointing upwards. The same is true for the Honeywell HPA300 Air Purifier (Case A), which served as our baseline/control for comparison with Cube results.
We simulated two minutes of particle evolution and recorded where the droplets were located after those two minutes. Droplets were judged to have either landed and stuck to surfaces or remained airborne. In terms of the risk of spreading a communicable disease, droplets that remain airborne or that land on readily accessible surfaces within the room are considered high risk. Droplets that land on floor or walls are considered medium risk. And finally, droplets that land on the filters or on the ceiling are considered the lowest risk. Figure 7 below is exemplary graphic showing the droplets colored by the surface set they have landed on during the two minute simulation.

Figure 7: Example CFD Result Demonstrating the Surfaces Upon Which Particles Have Landed During Two Minutes of Time
The first comparison to make is between the Honeywell HPA300 and the Cube. As shown in the Figure 8, the Honeywell removes only a small fraction of the droplets. The large majority of small droplets remain airborne and the large majority of larger droplets land on surfaces within the room and the floor. Very few droplets land on walls or the ceiling. Even though the Honeywell HPA300 has a high MERV rating, the fact that it cannot ‘get’ the airborne particles to its collection surface/intake reduces its actual particle capture capability. The flow rate of the HPA300 is only 37.2 CFM, which means that it would take over an hour and a half (3744 ft3 / 37.2 CFM = 100.6 minutes) to turn over (treat) the air in the room. In addition, in the two minutes of our simulation time, only 0.02 ‘air volume changes’ were achieved (2 minutes / 101 minutes = 0.02 volume changes). In summary, as far as air movement, the HPA300 just isn’t large enough for our classroom, and the percentage of 3 and 10 µm particles that remain airborne are 95% and 87%, respectively.
In contrast, as shown in Figure 9, using the Cube filter eliminates almost entirely (>99% Removal) the smaller droplets from the air. It does this by collecting more of the droplets on the active filter surface and by forcing entrained droplets to collide with ceiling and wall surfaces at higher rates. The number of large droplets eventually landing on accessible surfaces (tables, chairs, floor) is also reduced through more active filtration and a higher number of particle collisions with the ceiling and walls. 99% of 30 µm particles landed on these accessible surfaces in the baseline simulation while only 40% landed on these surfaces in the Cube simulation.
Comparing the flow rate achieved, the Cube moves much more air than the HPA300. At 1400 CFM, the Cube’s turnover time for the classroom is 2.7 minutes (3744 ft3 / 1400 CFM = 2.7), which suggests it is more appropriately sized for our room. In the two minutes of simulated time, the Cube achieves 0.74 room turnovers (air changes) compared to the 0.02 turnovers the HPA300 achieved. In contrast to the HPA300, the 3 and 10 µm particles remaining airborne with the single room-centered Cube were predicted to be just 1% and 0.7%, respectively.

Figure 8: Honeywell HPA 300 Results - Room Centered

Figure 9: Cube Results - Room Centered
The second comparison we make is between the Cube in the center of the room versus the Cube at one end of the room, which will likely be a more convenient location for electrical power input. The results, as shown in Figure 10, are much the same for the end wall centered Cube as for the prior room centered Cube (Figure 9). Overall capture and elimination of airborne droplets is largely unchanged. Slight tradeoffs between the various end capture surfaces can be seen.

Figure 10
Finally, we look at two additional scenarios where two Cubes are used, one scenario with Cubes centered on end walls (Figure 11), and one scenario where the Cubes are slightly offset from centered along the side walls (Figure 12). In the former, the share of 10 µm and 30 µm droplets landing on accessible surfaces are significantly reduced, compared to a single cube, and filtration of 100 µm droplets is increased from around 10% in previously covered scenarios to 18%.
Similar improvements are not evident for the side wall, off-centered scenario presented in Figure 12. This indicates that centering the Cubes on opposing walls sets up beneficial circulations in the room increasing the collection of particles on the filters and the lower risk surfaces (walls/ceiling).

Figure 11

Figure 12
Summary
In summary, a low-cost, easy to assemble Cube filter placed either in the center of the room or centered along an exterior wall results in a reduction of more than 99% of 3 µm and 10 µm airborne droplets within two minutes, as demonstrated with a dispersed droplet classroom CFD simulation. In comparison, a typical off-the-shelf air purifier was shown to eliminate less than 15% of the same sized airborne particles. A somewhat surprising result is the relative importance of the dynamic of particles being entrained into airflow circulation patterns and then being removed from the air through collisions with ceilings and walls.
Further, Cube filters significantly reduced the share of larger droplets (30 µm and 100 µm in our simulations) landing on high-risk, accessible room surfaces (desks, chairs, floors, etc.).
While not as dramatic as the improvements in going from an off the shelf air purifier to the Cube purifier, going from one Cube to two Cubes centered along opposing walls also resulted in improved capture efficiencies.
While correlation does not imply causation, we are happy to note that the school at which these Cubes were deployed has experienced the lowest contagion rate to date of all Durham County public schools, having only one confirmed COVID case so far this school year.
Figure 13; Animation of Particle Evolution for Scenario D
Sources
F. E. Buckland and D. A. J. Tyrrell, “Loss of infectivity on drying various viruses,” Nature 195, 1063–1064 (1962).
Duguid, J. P. (September 1946). "The size and the duration of air-carriage of respiratory droplets and droplet-nuclei". Epidemiology & Infection. 44 (6): 471–479
Dols, William & Polidoro, Brian & Poppendieck, Dustin & Emmerich, Steven. (2020). A Tool to Model the Fate and Transport of Indoor Microbiological Aerosols (FaTIMA). 10.6028/NIST.TN.2095.